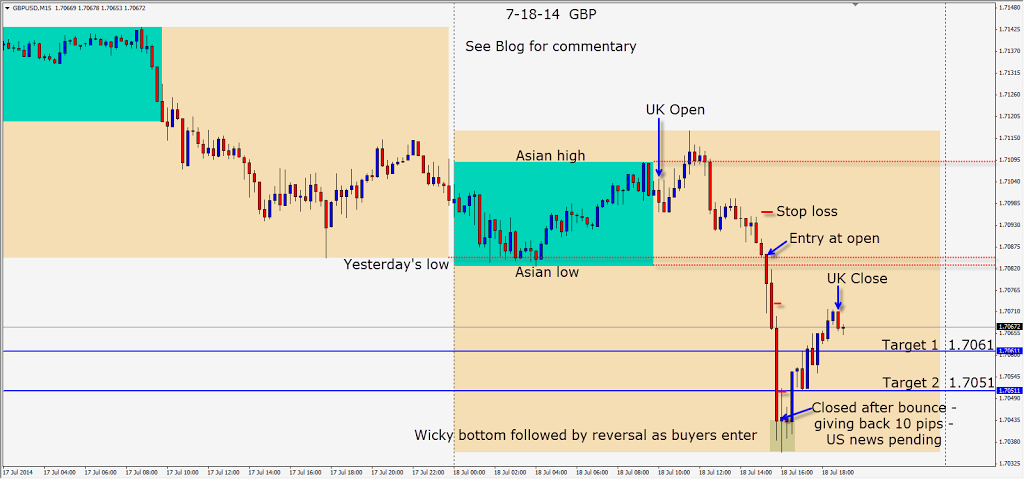
The GBP began to rise early in the UK session above the Asian session highs. This is usually a trap which lures in retail breakout traders and is followed by a pullback to stop them out. I was taught by a huge Chicago trader years ago to NEVER be a breakout trader! (Hint)
When I see the breakout traders lured in and the market pull back, I wait for a second round of the breakout and pullback to occur. There is an art to this and it didn’t set up that way this session. On Thursday it set up nicely and unfortunately the market didn’t move much… but the setup was clear. The Big Boys call this a wash and rinse.
Today as price began to descend with lower highs, there is one candle low that concerns me, so I wait another 15 minutes before entering. The session low is clearly taken out and the Reward to Risk is 3:1 to my Target 2 -which is acceptable… a 2:1 RR once the US traders have begun is acceptable to me also, because I have 4 or less hours left in the UK session from that point.
Our Target 1 coincidentally coincides with the June 19 2014 high and the July 15 2014 low. This area will be ripe to be retested by price and it is today.
Price continues to drop and we protect our profits while in the move and especially when price breaks below our Target 2. We know US economic news is pending and as buyers begin to enter, the move down concludes for the session. Price comes right back to our Target 2 – retests the level – moves up to our Target 1 and rises above the previously mentioned levels of June 19 and July 15.
A currency pair will typically move so far in a given day and then reverses to trap traders into holding their positions longer or overnight. Institutions can well afford to take longer term position trades and do, but retails traders are often frustrated giving back their profits to retracement traps off highs and lows of a day. It’s better to know statistically how far a pair may move given its current market behavior. This is how we set our Targets 1 & 2. Trading is not an exact science – it’s an art and the more you know about what matters to the BIGGEST traders and how to see the charts the way they see them, the easier it is to identify high probability trade setups. Despite what many marketers would tell you, a Stochastic, RSI, MACD, Bollinger band etc. are not used by most large institutional traders and at best they are simply lagging indicators. If you want to learn what the largest traders use… and are willing to put in many hours of practice learning how to trade, contact me.
Good luck with your trading. Enjoy your weekend!
