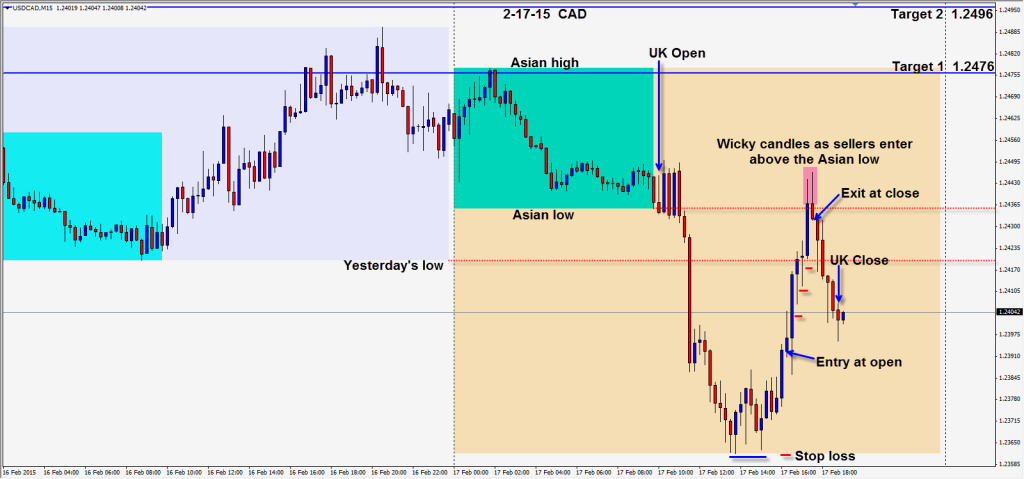
As the US session got underway today the price of WTI crude oil was falling. At the same time the CAD made essentially a triple bottom for the session and began to climb higher. We enter the CAD long with an initial stop loss below structure. WTI continued to move down and the CAD moved higher.
When price attempts to get above the Asian session lows – sellers enter. WTI not coincidentally had just made its expected range for the day or what we refer to as Target 2. A second wicky and bearish candle paints and we exit the trade. As WTI had made its range, it is more likely to reverse than continue lower – unless a news event occurs adding further downside momentum. My students will also note that our very simple pattern completed.
If your trading platform doesn’t provide a WTI chart, find one on the internet as the USDCAD correlation is currently very high. This pair can be quite volatile so keep your stops and take profits tight and watch WTI’s moves along with it.
Back tomorrow if we find a trade in advance of FOMC.
Good luck with your trading!
