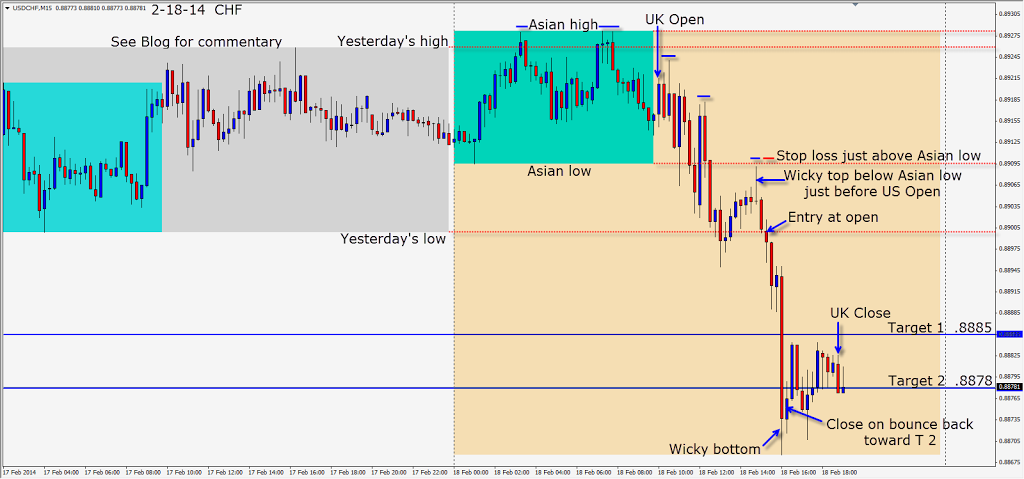
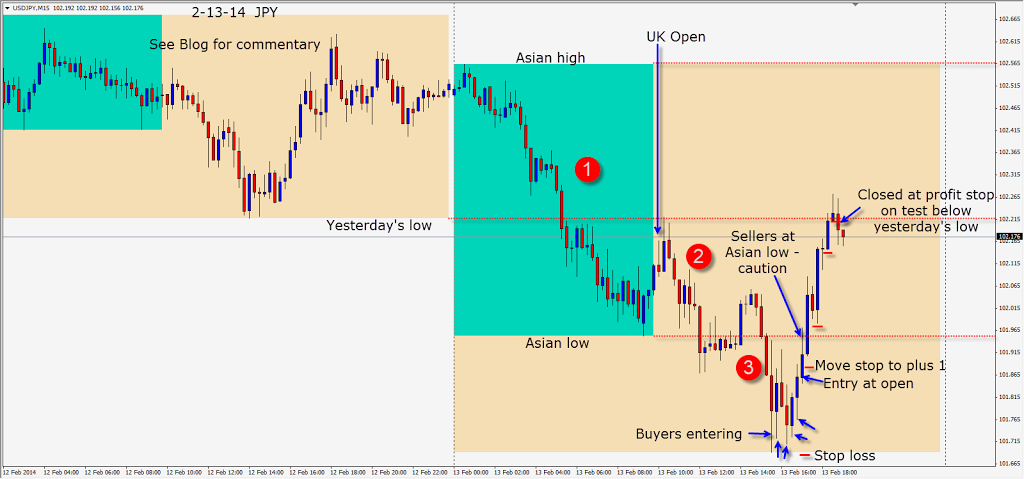
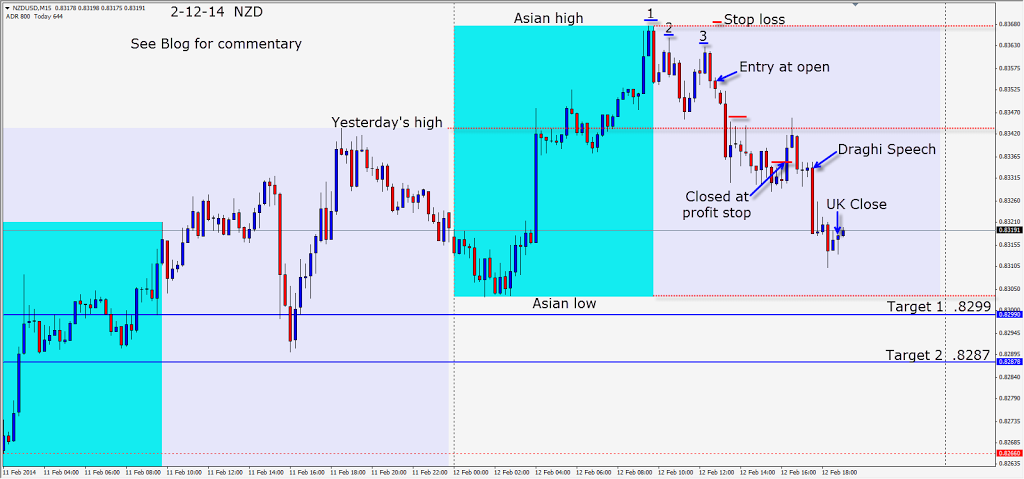
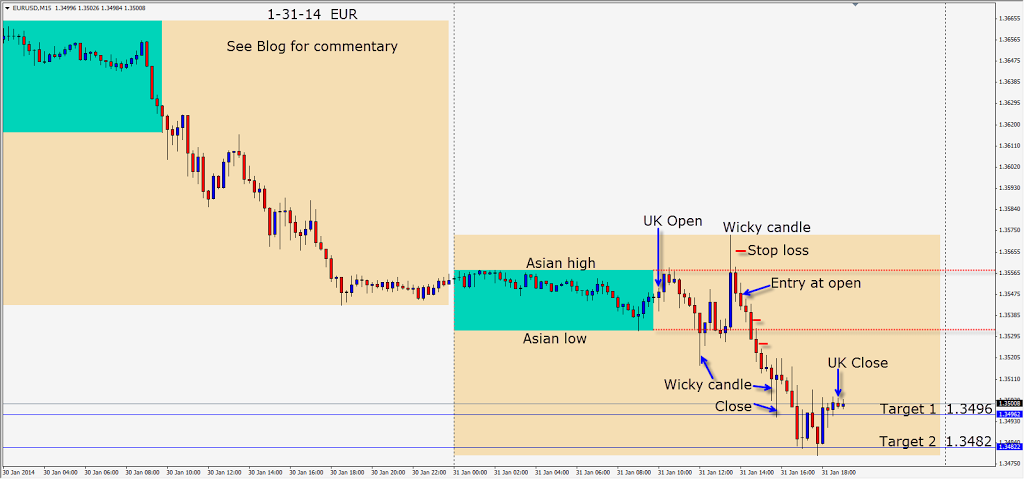
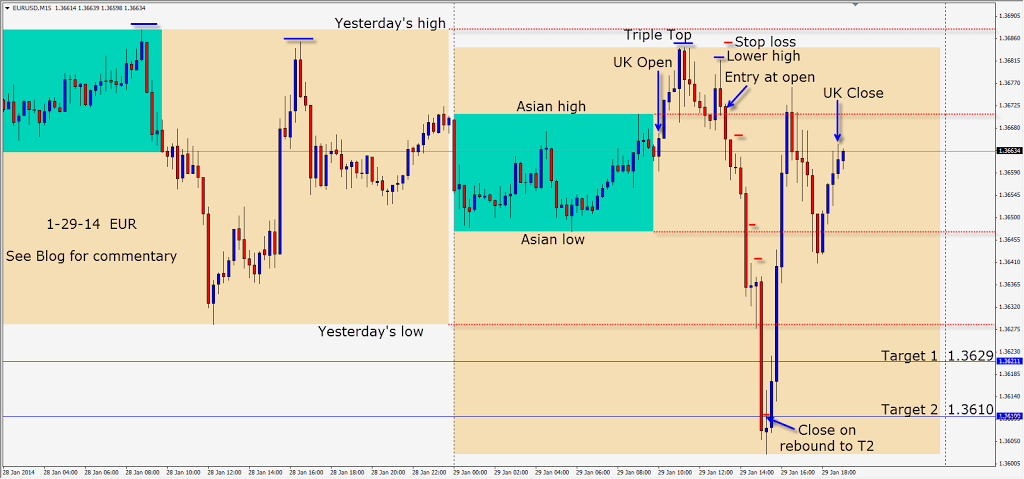
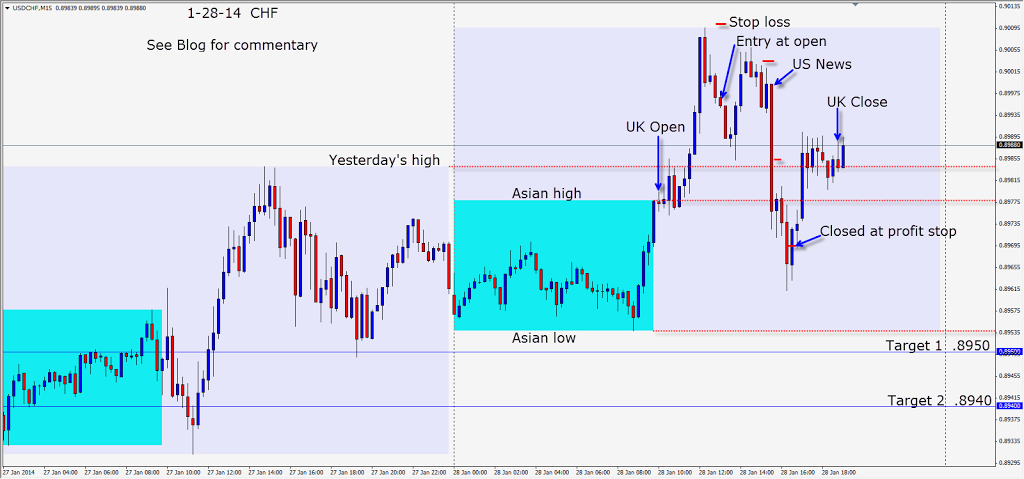
EUR continues to stairstep down. The chart is self-explanatory.
I’m going to share a few secrets today. I was taught how to trade by one of the largest traders in the world. He trades in the billions of dollars. He has over 40 years of trading under his belt. He has trained some of the largest and most influential market participants. He uses only one tool on his charts and uses NO other indicators!
He looks at a plain vanilla chart and reads price behaviour. He applies his one tool, money management, and trades accordingly. He maintains that “price” is the best indicator. Learn how to interpret what it is telling you! Trade the charts that make sense to you and follow your trading rules.
On January 14th, the EUR makes a high of 1.3698 then closes below it. On January 20th, the EUR puts in a low of 1.3507 and closes above it. On January 23rd, the EUR closes at 1.3695 – 2 or 3 pips off its high. On January 24th, the EUR attempts to move higher and cannot close above the previous day’s close and leaves a sizable wick above the body. Price begins to stairstep down each following day. Sellers are pushing price lower. Our target is 1.3521. A huge target is the January 20th low at 1.3507. There will also be an options level at 1.3500.
If you understand that this is what the largest traders are focused on, you can trade behind them. If not, you risk being stopped out by them.
Enjoy your weekend!
Back Tuesday following NFP if we find a trade.